
SawtoothTrade
|
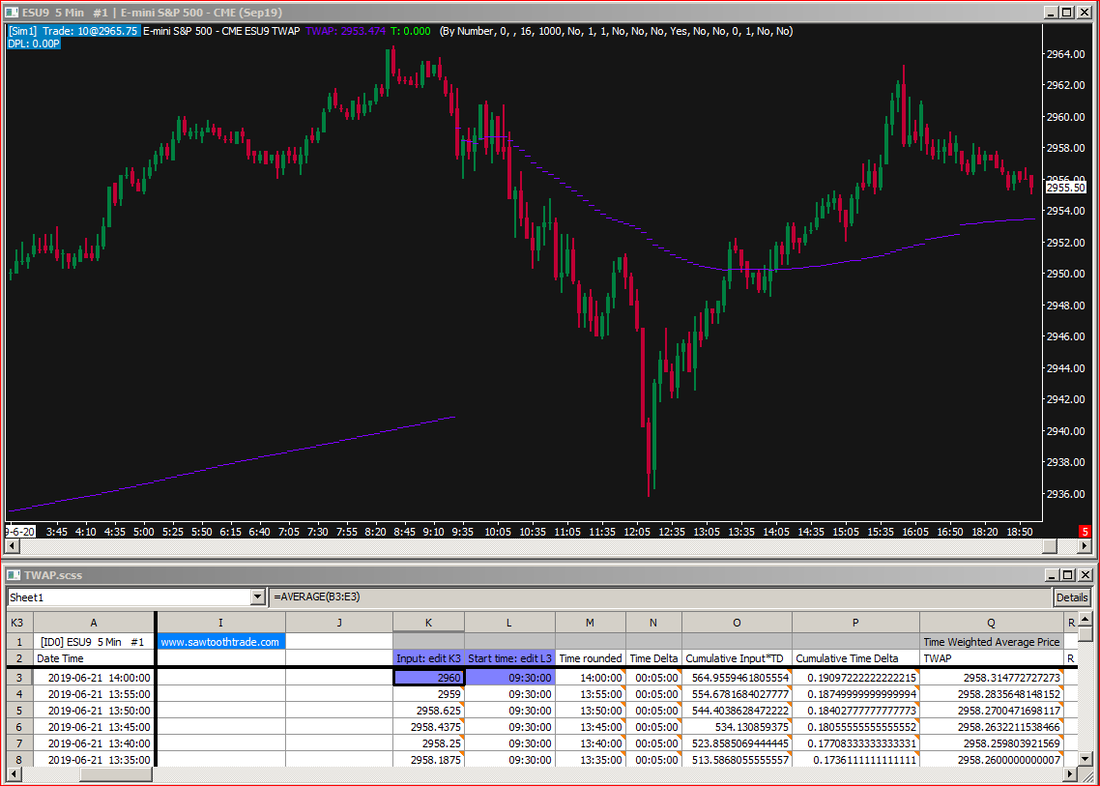
Time Weighted Average Price
|
This spreadsheet study will calculate the Time Weighted Average Price and plot the line on the chart.
This is a self-contained standalone study that does not reference any other study, and it works on all intraday bar types. It will not work on Historical charts. The user sets the Input value in cell K3. The default is a formula that returns the OHLC average. The user also sets the Start time in cell L3. The format needs to be hh:mm:ss Click on each of these links to download: TWAP.StdyCollct+ TWAP.scss and put both files in your Sierra Chart \Data folder. The study collection will load the correct spreadsheet study with the correct settings. You must use the study collection to add this study to a chart. The spreadsheet file contains the formulas; you must download both files. This study was created on Chart 1. If you add this study to a chart other than Chart 1, you must copy/paste cells K1:Q3 from Sheet1 to the Sheet# that corresponds to the Chart# where this study is added. You then must use these cells to set the user options on that new Sheet#. |