
SawtoothTrade
|
Defining Range / Implied Defining Range
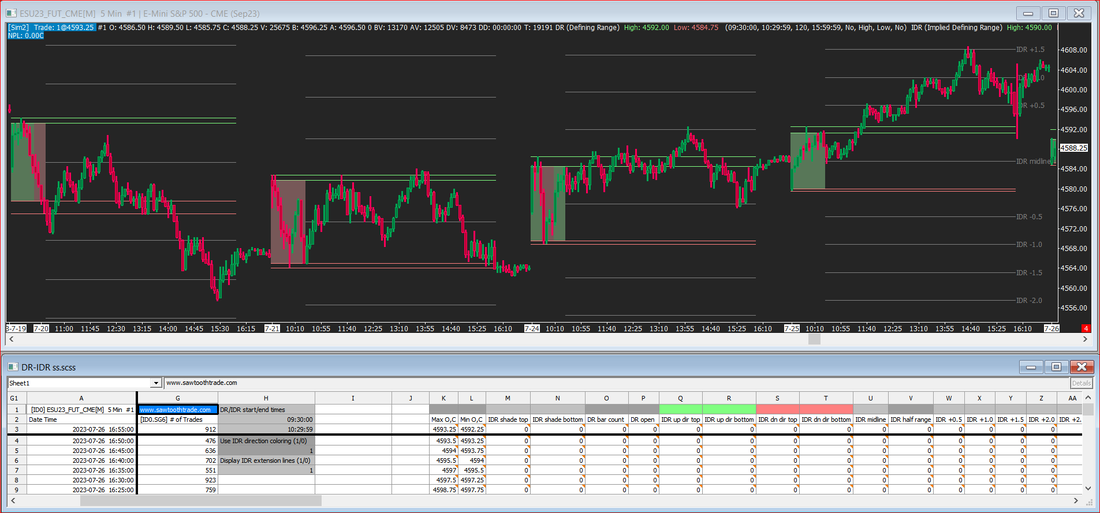
This chartbook and spreadsheet file will draw the Defining Range (DR) and the Implied Defining Range (IDR). It uses two instances of the High/Low For Time Period study as a basis, then the spreadsheet formulas calculate all of the other lines and shading.
User options include:
- DR start and end times.
These must match the times set in both High/Low For Time Period studies.
- Use IDR direction coloring.
When set to 0, the shading is gray.
When set to 1, the shading is based on the DR Open and Close.
- Display IDR extension lines.
When set to 0, there are no extension lines.
When set to 1, 20 extension lines are drawn, 10 above and 10 below.
Note: When changing these settings, please do a Chart >> Recalculate.
Click on each of these links to download:
DR-IDR SS.cht
DR-IDR ss.scss
and put both files in your Sierra Chart \Data folder.
You must download both files so that the spreadsheet study uses the correct settings.